
Two formats that look similar and behave very differently
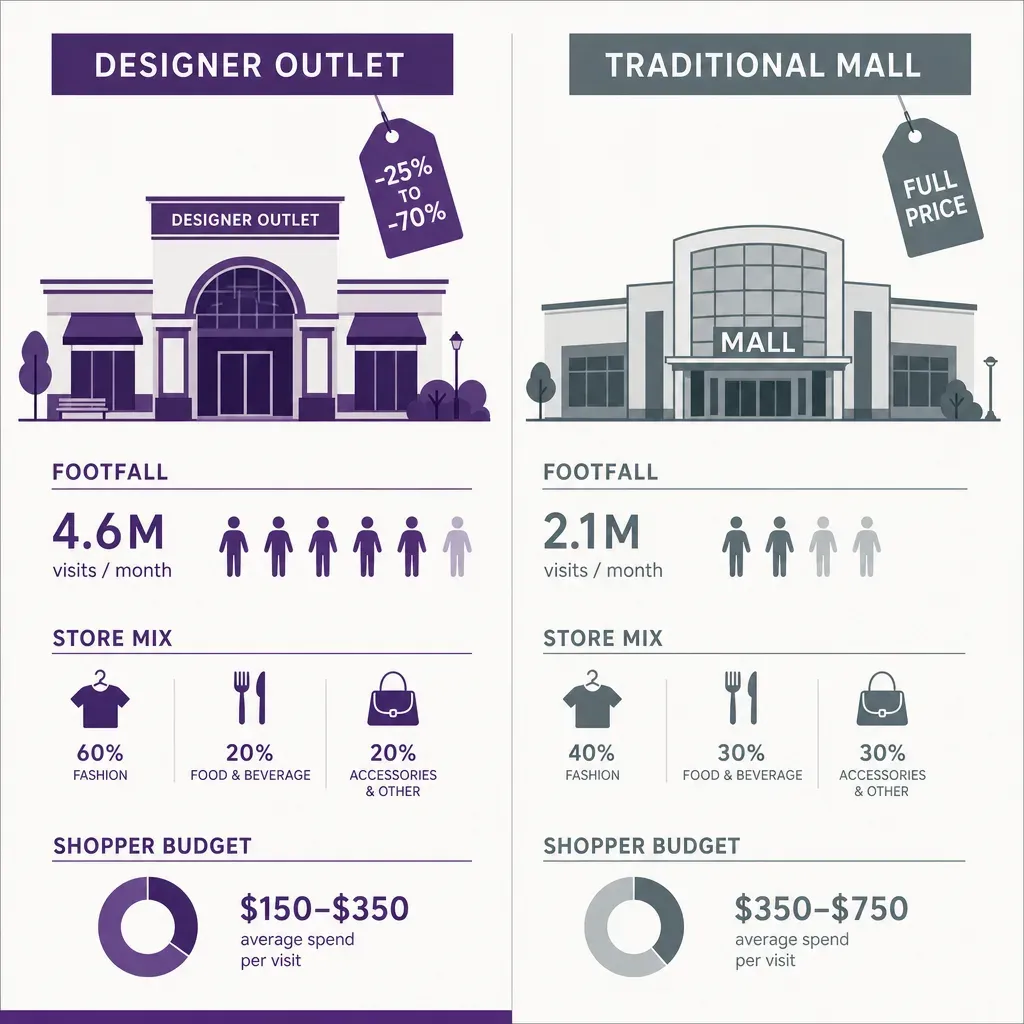
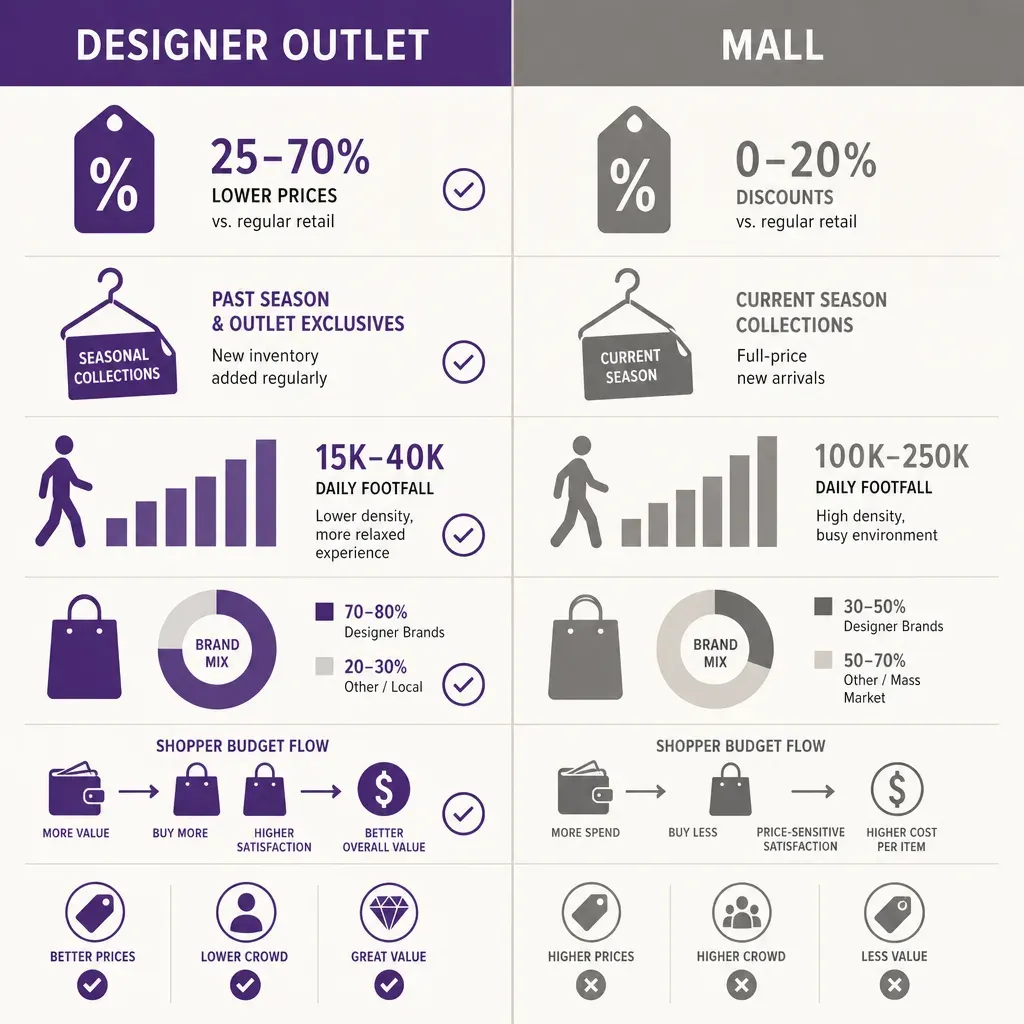
A designer outlet center and a traditional shopping mall sit on the same line of any retail-property report. Both are large, enclosed or semi-enclosed schemes with a mix of fashion, food and accessory brands, both rely on footfall for their rent roll, and both compete for the same shopper budget. From the outside, the difference can look like little more than a positioning choice. The outlet center sells last season at a discount, the mall sells current season at full price.
Inside the data, the two formats behave very differently. They draw a different visitor on a different day of the week, hold them for a different length of time, in a different group, with a different conversion profile and a different relationship with the anchor tenant. Treating them as one asset class is a quick way to make poor leasing, marketing and capital-investment decisions. This post sets out the differences that matter, where outlet centers and shopping centers optimise for different things, and the trend lines worth watching. All figures in this article are illustrative, used to make the comparison concrete; treat them as indicative ranges rather than measured Ariadne benchmarks.
Visit cadence: frequency versus basket
The first difference is how often the same shopper comes back. A traditional mall, especially one anchored on a regional catchment, tends to draw a high-frequency local visitor. A non-trivial share of footfall is monthly or better, with some shoppers visiting weekly because the mall is also where they buy groceries, eat lunch, or meet a friend after work. The average ticket per visit is modest, because the trip is routine and the shopper has not necessarily come with a single purchase in mind.
A designer outlet is closer to a destination than a habit. Many outlets sit outside the urban core, often near a motorway junction or an airport, and pull a regional or international catchment rather than a neighbourhood one. The same shopper might come twice a year, perhaps four times if they live locally and the outlet runs strong seasonal events. The trip is planned, the visit is longer, and the basket is materially larger because the shopper has effectively saved up the trip for a discount-heavy spend. As an illustrative pattern, an outlet visitor might come a third or a quarter as often as a regional-mall visitor but spend two or three times the basket per visit.
That difference matters at the leasing table. A mall tenant prices its rent against high visit frequency and modest basket. An outlet tenant prices its rent against low visit frequency and a larger, planned basket, often with a tighter conversion target and a margin set by the discount structure of the format. Same square metres, very different unit economics.
Dwell time and how the building is laid out
Dwell time, the average length of time a shopper spends inside the scheme, is the second clean separator. Indicative ranges from public industry research and operator commentary suggest a traditional regional mall sees an average visit of roughly 60 to 90 minutes. A designer outlet typically sees noticeably longer visits, often in the 120 to 180 minute range, with some destination outlets pushing further when food and leisure tenancy is strong.
The longer outlet dwell comes from three structural reasons, not from any single tenant decision.
- The visit is a trip. A shopper who has driven 45 minutes to reach the scheme is unlikely to leave after 30 minutes. The travel cost commits them to staying.
- The format rewards browsing. Outlet shopping is by design a treasure-hunt experience: the brand, the size and the price all have to align, which means walking past more units before a purchase clicks. A full-price mall trip can be transactional and short.
- The plan is usually linear. Many outlets are laid out as a village or a single long mall axis with food and rest stops along the way, which encourages continuous movement and a long lap. A traditional mall, especially one with multiple levels, lets a shopper enter near their target store, complete the purchase and exit on the same level.
The practical implication for landlords is that the outlet's longer dwell creates more secondary spend opportunity per visit, particularly in food and beverage, which is one reason F&B GLA shares tend to be higher in successful outlet schemes than in older mall stock.
Group size and visitor mix
The third clear difference is who comes through the door. A traditional mall, run on a local catchment, sees a high share of solo visits and small groups (one or two people) on weekdays, with families and friend groups concentrated on weekends. The mix shifts week by week with the local rhythm: school holidays, payday weekends, weather, sport.
Designer outlets skew toward larger groups and a heavier tourist component. Many outlets explicitly market to coach tours, cross-border shoppers and airport stopover visitors, and the mix of groups of three and four (couples with parents, friend groups, families on a day trip) is visibly higher than at a comparable regional mall. The tourist share can be substantial at outlets near major airports or border crossings, and that group brings two operational consequences worth measuring.
- Higher catering load per visit. Larger groups mean longer queues at food, more table turns, and a higher peak-hour stretch on F&B operators.
- Lower price sensitivity in pockets. Some outlet tourist segments are spending in a currency that makes the discount look deeper than the local shopper sees it, which props up basket and conversion in luxury units even in soft local trading conditions.
Measuring group size without resorting to surveys or cameras is the part most landlords find hardest. The header count at the door tells you how many people came in, not whether they came together. Ariadne's patented signal sensing was built for this, and we say more about how that works in the technology note further down.
Weekday and weekend mix
The fourth difference is the shape of the week. A regional mall serving a daily catchment will commonly do somewhere between 45 and 55 percent of its weekly visits on Saturday and Sunday, depending on country and trading-hour rules. Midweek footfall is real and matters for tenants, but the centre of gravity is the weekend.
A designer outlet, because the trip is planned, is even more weekend-loaded. It is not unusual for an outlet to see 55 to 65 percent of weekly visits on Saturday and Sunday, with Friday afternoon as a strong third day driven by short-break travel. Public holidays around the trip-friendly months of the year (long weekends, school holidays, the run-up to gifting seasons) can pull peak-day shares well above the weekly average.
What this means in operations terms is that the outlet's resource model has a sharper peak. Staffing, F&B prep, car-park stewarding and security all have to scale to a weekend wave that may dwarf the midweek baseline by a factor of three or four. A regional mall has more even staffing pressure and a more predictable hourly load.
What each format optimises for
Once the visit pattern is set out, what each format optimises for follows naturally.
What an outlet center optimises for
An outlet's economics are built around a long, planned, high-basket visit from a non-local catchment. The landlord's job is therefore to maximise the quality of that visit and to deepen catchment reach.
- Dwell. Long visits are the basis of the model. Food and beverage capacity, rest areas, family facilities and weather-protected walkways are treated as primary infrastructure rather than amenities.
- Conversion per visit. Because each shopper paid a travel cost to be there, the landlord and tenants both work to send them home with bags. Discount structures, brand mix and store layout are tuned to convert a planned visit, not to win an impulse one.
- Catchment reach. Marketing spend goes into tourism partnerships, transport links, coach packages and cross-border campaigns. The job is to widen the catchment, not to deepen frequency.
- Day-trip experience. Events, seasonal programming and entertainment are framed around making the trip itself worth the journey, not just the shopping.
What a traditional mall optimises for
A regional mall's economics are built around frequency. The same shopper has to come back enough times for the basket to add up to a meaningful annual spend, so the building has to fit into routine life.
- Frequency. The landlord's marketing focuses on loyalty, app engagement, parking ease, and any reason a shopper can be persuaded to come back next week.
- Cross-category visit. Anchor tenants, services like banks and clinics, and a strong grocery or supermarket pull the same shopper for multiple errands in one trip, which is the easiest way to keep frequency high.
- Catchment penetration. Marketing spend goes into being the default place in a local radius, not into pulling a shopper from two hours away.
- Weekday programming. Lunchtime and after-work footfall, evening dining, and midweek events all matter because they fight the weekend skew.
The KPI list looks different
If you read an outlet operator's annual report next to a regional-mall operator's, the KPIs they lead with diverge in a way that mirrors the differences above.
- Outlet center KPIs. Sales per visit, average dwell, tourist share of visits, weekend mix, F&B sales as a share of total, brand sell-through against last season's stock, conversion rate.
- Traditional mall KPIs. Footfall versus last year, visits per catchment household per month, anchor co-tenancy compliance, occupancy cost ratio, sales density per square metre by category, repeat-visitor share.
Both formats care about all of these. The point is which ones lead the conversation, because that signals what the asset is built to do.
Trend lines worth watching
Three trend lines change the comparison enough to be worth tracking explicitly over a multi-year hold.
- Outlet centers slowly converging on full-price formats. Mature outlets are adding leisure, entertainment and full-price flagship units, partly to extend dwell and partly to recruit a wider visitor. That softens the format line.
- Traditional malls leaning harder on F&B and experience. As department-store anchors shrink, malls are filling boxes with food, fitness, cinema and healthcare. The result is a longer dwell pattern that pushes regional malls modestly toward outlet-style time per visit.
- Tourism dependency cuts both ways. Outlets that lean heavily on tourist coaches and airport spillover are exposed to travel disruption (the pandemic was the obvious example, but currency, visa, and aviation-capacity shifts all matter). Regional malls are insulated from that risk by construction.
How the data is collected matters
Most of the differences above only become decision-useful when the underlying footfall data is collected the same way on both sides, with enough granularity to break visits into entries, dwell, group size, day-part and zone. The traditional door clicker, even modernised, gives you the entry count and nothing else, and surveys do not scale.
Ariadne measures this with Hybrid Fusion, its patented camera-free method. Time-of-Flight depth sensing counts every visitor at the entrances, capturing geometry rather than images, while patented phone signal sensing follows movement through the interior, detecting the signals a phone emits even in airplane mode. The sensor streams both feeds to Ariadne, where Hybrid Fusion combines them into one trajectory per visit and computes counts, dwell, and paths. The streams carry no identifier: no MAC address, no device ID, no biometric data, and no camera is involved. Identifiers are stored only when a visitor explicitly opts in, which keeps the method GDPR-friendly and outside biometric territory.
For an outlet operator, that means dwell, group composition and tourist-friendly zones (food, rest, brand flagships) can be read continuously without any camera infrastructure, and without any personal data leaving the building. For a regional-mall operator, the same method delivers per-zone frequency, anchor spillover and time-of-day load with the same privacy profile. Both formats can then be benchmarked on like-for-like definitions, which is what makes the comparison in the rest of this article fair. We cover the operator-side detail in our work on people counting for retail, and the format guidance in our shopping centers hub.
FAQ
Do designer outlets and malls compete for the same shopper?
Partially. Both compete for fashion and accessory spend, but the typical outlet trip is a longer, planned, lower-frequency visit from a wider catchment, while the typical mall trip is a shorter, more frequent visit from a local catchment. A shopper might use both formats in the same year for different reasons, and a meaningful share of outlet footfall is incremental rather than cannibalised from nearby full-price retail.
Is dwell time always higher at outlets?
On average, yes, and the structural reasons (travel cost, treasure-hunt format, linear layout) are stable enough that the gap is unlikely to close to zero. The two formats are converging modestly as malls add F&B and experience, but outlets retain a clear dwell advantage in most operator commentary.
What is the right footfall KPI to compare the two?
There is no single right KPI. Visits per week and sales per visit, read together, capture most of the difference. Adding dwell and weekday/weekend mix gives a defensible picture of how each asset is performing against its own model, which is the comparison that matters for investors and tenants.